

The Detroit Red Wings' playoff chances sit at 0% as of April 12, 2026, after a 5-3 loss to the New Jersey Devils mathematically eliminated Detroit from postseason contention on April 11. That result closed the door for a 10th straight season. There's no scenario math left to run this year, but the season that got them here, and what Detroit needs to change next year, is worth breaking down in detail.
TL;DR:
- Detroit's playoff chances dropped from near certainty to 0% over March and April due to scoring droughts and late-game collapses.
- Winning head-to-head matchups against wild card rivals and capitalizing on favorable schedules were the critical late-season scenarios that could have kept them alive.
- Odds fluctuate sharply in the final games, especially when facing playoff contenders or losing leads late, with schedule strength and head-to-head results heavily influencing probabilities.
- Injuries to top players and poor third-period execution significantly impacted Detroit's chances, with late-season timing worsening their outlook.
- The team’s prolonged drought and reliance on young players mean modest improvements next season could notably change their playoff prospects.
Table of Contents
- Current Red Wings Playoff Chances: Snapshot and Recent Trend
- What Scenarios Could Have Kept Detroit Alive?
- How Do Playoff Odds Actually Move Game to Game?
- How Clinch Calculates Playoff Odds
- What Does a 5% Playoff Chance Actually Mean?
- How Injuries Reshaped Detroit's Playoff Math
- How Does This Season Compare to Detroit's Recent Playoff Droughts?
- Which Player Performances Shaped Detroit's Odds This Season?
- Could Trades Have Changed Detroit's Playoff Path?
- What Do the Atlantic Division Standings and Tiebreakers Show?
- Clinch's Perspective on Tracking Detroit's Odds
- Where to Track Detroit's Playoff Odds Next Season
- Sources
- FAQ
Current Red Wings Playoff Chances: Snapshot and Recent Trend
The trend line tells the real story. Detroit's odds didn't collapse in a single week. They eroded steadily through March and April as the Red Wings missed the playoffs for a 10th straight season, with scoring droughts and third-period letdowns cited as the primary drivers.
Here's where the numbers stood heading into the final stretch:
- Make playoffs: 0% (eliminated April 11, 2026)
- Miss playoffs: 100% (confirmed)
- Data source: Clinch's live simulation feed, last updated after the Devils game on April 11, 2026
That's the current state. For live tracking on next season's race, Clinch's Detroit Red Wings playoff odds page updates automatically after every game once the 2026-27 schedule opens.
What Scenarios Could Have Kept Detroit Alive?
Detroit's elimination is final for 2025-26, but understanding which scenarios actually mattered helps explain how tight the race was and what to watch for next time the Red Wings are in a similar spot. Here's what a realistic late-season path back into contention typically requires.
- Win the head-to-head games against direct wild card rivals. Games against teams occupying the final wild card spots carry double weight because they're a two-team swing. A single regulation win against a rival flips two points in the standings, not one.
- String together a positive record in one-goal games. Detroit's late-game collapses turned winnable third periods into losses repeatedly this season, according to NHL.com's season analysis. Fixing that alone would have added several points.
- Catch a favorable schedule stretch against non-playoff teams. Detroit's remaining schedule was actually more favorable than some rivals at points in March, but capitalizing on it required consistent goal tending and finishing.
- Get a hot streak from the power play at the right time. Special teams swings often decide close playoff races in the final two weeks.
Pro Tip: When tracking a bubble team's live odds, watch for the "sensitivity" games Clinch's model flags as must watch. These are usually the two or three remaining matchups where a single result swings probability more than any other game left on the schedule.
How Do Playoff Odds Actually Move Game to Game?
Odds swing hardest late in the season, and Detroit's collapse from playoff-adjacent to mathematically dead illustrates exactly why. When 70 games remain, one loss barely moves a percentage. When five games remain, one loss can wipe out 15 to 20 percentage points overnight, because there's less schedule left to absorb the damage.
A few factors drive those swings more than fans expect:
- Remaining schedule strength. A team facing four playoff contenders in its final six games sees odds drop faster after a loss than a team with a softer closing stretch.
- Head-to-head tiebreakers. Wins against direct wild card competitors count twice, once for the standings point and once for the tiebreaker edge.
- Goaltending variance. A single hot or cold week from a starting goalie can shift expected goals against enough to move simulation outputs several points.
- Third-period execution. Detroit's pattern of losing leads late in games created exactly the kind of variance that clusters around low-probability outcomes once few games remain, per NHL.com's reporting.
Small events carry outsized weight in the final stretch. That's the nature of a compressed schedule.
How Clinch Calculates Playoff Odds
Clinch runs 30,000 Monte Carlo simulations after every NHL, NBA, and MLB game to generate playoff probability updates. Each simulation replays the remainder of the season using current team strength ratings, the actual remaining schedule, and home/away splits, then tallies how often each team's outcomes land in the playoffs, out of the playoffs, or in a specific seed range.
30,000 simulations per update, refreshed after every single game. That cadence is what separates a live probability feed from a static preseason projection.
The model draws on a handful of core inputs:
- Team strength ratings based on recent performance, not just season-long averages
- The actual remaining schedule, including opponent quality and rest days
- Home and away performance splits for every team in the league
- Simplified injury handling, which adjusts team strength when a significant absence is confirmed
Every output carries a timestamp because probabilities from three days ago don't reflect a lineup change or a key injury announced since. Clinch's own methodology page breaks down the tiers and what each percentage range actually implies. The model's limitations matter too: it can't fully price in a trade before it happens, and injury impacts are estimated rather than measured precisely, which is why every simulation output should come with its assumptions listed rather than presented as a bare number.
What Does a 5% Playoff Chance Actually Mean?
Historically, teams in that range complete the run far less often than they fall short, which is exactly why simulations exist: gut feel consistently overrates a struggling team's true odds. Low-probability paths mostly stay low-probability.
The practical move for fans tracking a bubble team is knowing which games to watch, not just which games your team plays.
- Your team's own games obviously matter most, but weight close, meaningful ones over blowouts against non-contenders.
- Direct wild card rival games, even when your team isn't playing, move your odds because every rival win or loss shifts the standings math.
- Divisional matchups between two teams ahead of you can create separation that helps or hurts depending on the result.
Clinch's games that matter tonight feed exists specifically to sort that noise, flagging which results on a given night actually move the number.
Pro Tip: A rooting guide is not a betting guide. Use probability shifts to decide which games deserve your attention, not to size a wager. Clinch's odds are built for fan engagement and season tracking, not for gambling decisions.
How Injuries Reshaped Detroit's Playoff Math
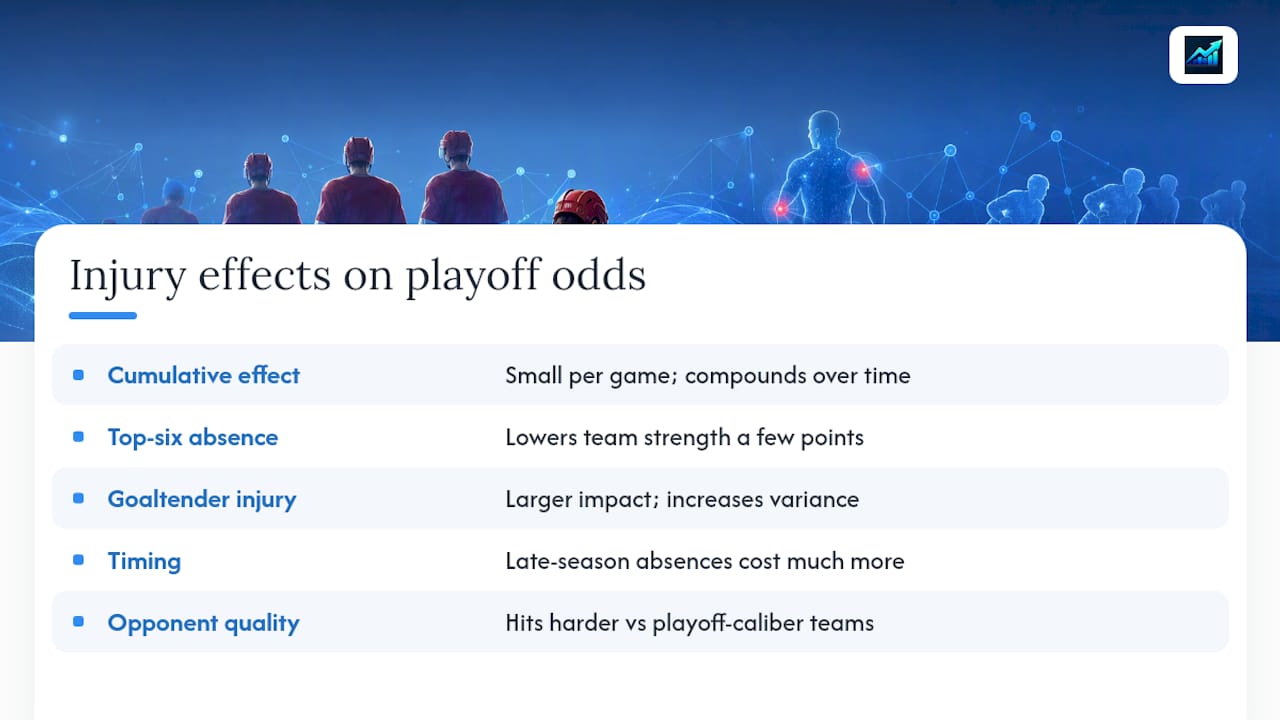
Injuries rarely show up as a single dramatic swing in simulation output. They accumulate. A top-six forward missing six games doesn't collapse a team's odds overnight, but it chips away at expected goals for, and that erosion compounds when it happens during a stretch against playoff-caliber opponents.
Detroit dealt with exactly that kind of grind through the season's second half. When a scoring-line contributor sits out during a stretch of one-goal games, the team's margin for error, already thin given the Atlantic Division's depth, disappears fast. Goaltending injuries carry even more weight in a simulation model, because a backup goalie's save percentage over a short sample introduces real variance into every remaining projected game.
The model handles this with simplified injury adjustments rather than precise medical modeling. A confirmed multi-week absence for a top-line player lowers that team's strength rating enough to shift probability by a few percentage points per game missed, but the model can't fully anticipate how a lineup reshuffles around the gap. Sometimes a call-up outperforms expectations and offsets the loss. Sometimes the drop-off is worse than any rating adjustment captured.
For a team already living on the bubble, injury timing matters as much as injury severity. A two-week absence in November costs far less than the same absence in late March, when there's no schedule left to recover the points. Detroit's late-season stretch offered little room to absorb exactly that kind of bad timing, and the simulation odds reflected it in real time as each update rolled in.
How Does This Season Compare to Detroit's Recent Playoff Droughts?
A 10th consecutive missed postseason puts Detroit's current stretch among the longest active droughts in the league, and it changes how any single season's probability should be read. A team with a recent playoff appearance carries built-in benefit of the doubt in projection models, reflected in slightly stronger baseline strength ratings. A team a decade removed does not get that benefit, and Detroit's simulated odds this season reflected a program still searching for the roster core to break the pattern.
Season-over-season, Detroit's peak playoff probability has crept modestly higher in recent years without ever crossing the threshold that usually signals a real contender. That's consistent with a young core still developing rather than a team regressing. The difference between this season and, say, three years ago is less about talent and more about consistency. Detroit has shown flashes of playoff-caliber hockey in stretches; it hasn't sustained it across 82 games.
Analysts projecting Detroit's longer-term outlook put the team in the mid-90s points range in a reasonable-case scenario for next season, which would represent a real step forward from this year's finish. The Atlantic Division's depth means even that improved point total offers little cushion. Historical context matters here: teams stuck in extended droughts rarely break through gradually. They tend to make a jump once the young core matures simultaneously, which is exactly the bet Detroit is making with its current roster build.
Which Player Performances Shaped Detroit's Odds This Season?
Simulation models weight recent performance more heavily than season-long stats, so individual stretches from key players moved Detroit's probability more than raw counting stats might suggest. The team's scoring woes, flagged repeatedly in season analysis, trace back to inconsistent production from the top six rather than a single missing piece.
Lucas Raymond's role as a top-line driver made his cold stretches disproportionately costly. When a team's leading scorer goes quiet for two weeks in February, the simulation model's team strength rating drops immediately, and that drop compounds across every remaining game in the projection. Simon Edvinsson's development on the back end mattered in a different way. Defensive stability changes goals-against expectations, and Detroit's inconsistency in that department fed directly into the third-period collapses that defined the season's late stretches.
Marco Kasper's continued growth as a two-way forward represents the kind of quiet, unglamorous performance that rarely gets attention but shows up in underlying model inputs. Depth scoring, not just top-line production, determines whether a team can survive a schedule stretch against strong opponents without bleeding points.
The DailyFaceOff preview makes the case directly: even modest improvement from this young core could shift Detroit's projected standings position by several points next season, which in a tight Atlantic race is often the exact margin between playing meaningful April hockey and watching from home again.
Could Trades Have Changed Detroit's Playoff Path?
Detroit stood pat at the trade deadline rather than making an aggressive push to bolster its playoff push, a decision that reflects where the front office genuinely believed the team stood in the race. Simulation models react immediately to confirmed trades, adjusting team strength ratings the moment a roster change is locked in, but a quiet deadline means no probability bump ever materialized.
That inactivity carries its own signal. Front offices selling or standing still near the deadline usually reflect an internal probability assessment that lines up with what the simulation models were already showing. If Clinch's odds had Detroit in a stronger spot, a buy-mode move would have been the more likely outcome.
Looking ahead, the DailyFaceOff preview frames next season's roster needs around internal development rather than external additions. That matters for how fans should read next year's opening odds. A team relying on Raymond, Edvinsson, and Kasper taking the next step carries more projection uncertainty than a team that added a proven scorer via trade, because internal development is harder to forecast than an acquired player's established track record.
Any trade before a playoff cutoff moves the needle in one of two ways: it either raises a contender's ceiling by adding a difference-maker, or it signals a rebuilding team's real timeline by what it gives up. Detroit's approach this season leaned toward the latter, and the simulation odds through the stretch run reflected a team without the roster to make a late push worth the cost of assets.
What Do the Atlantic Division Standings and Tiebreakers Show?
The Atlantic Division's depth is the single biggest reason Detroit's margin for error stayed razor thin all season. Multiple teams clustered near the wild card cutoff meant that head-to-head results and tiebreakers mattered more than they would in a division with a clearer hierarchy.
Regulation wins serve as the primary tiebreaker when two teams finish with identical point totals, which puts extra weight on how a game ends, not just whether it's won. A shootout win counts the same as a regulation loss for tiebreaker purposes in most NHL tiebreaker structures, which means Detroit's tendency toward close, extended games carried real standings risk even in games it won.
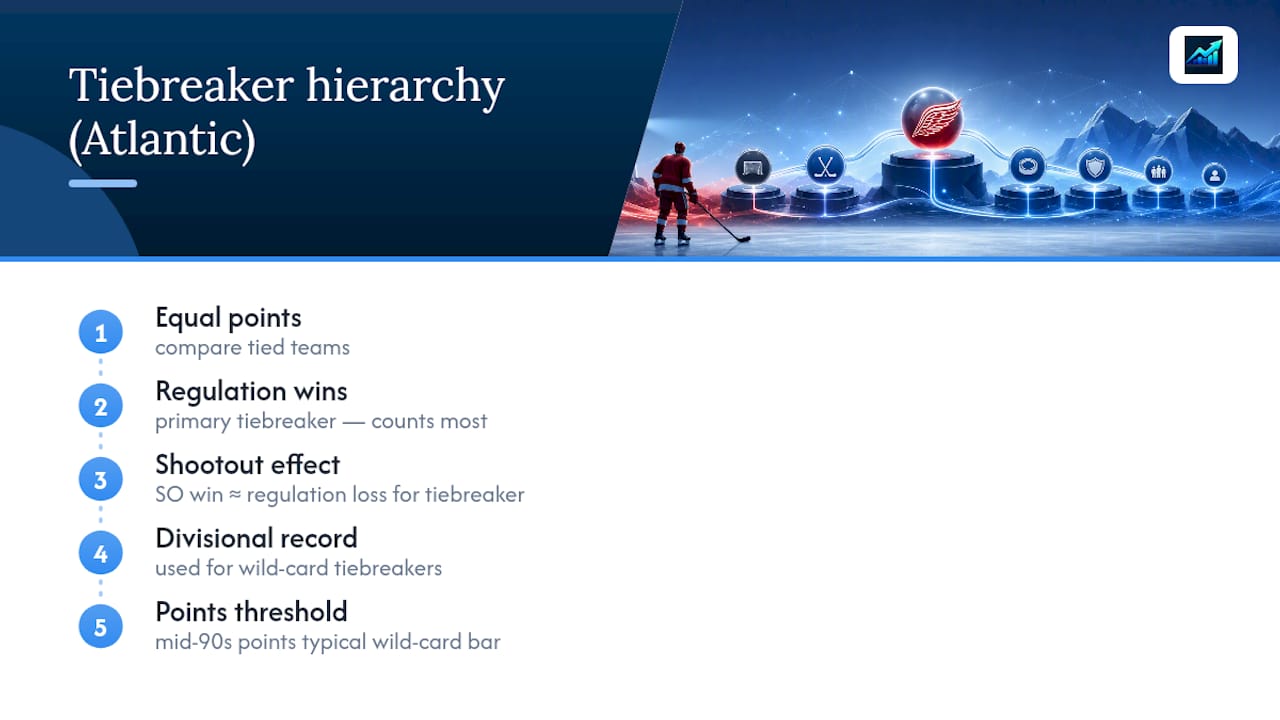
Divisional record factors into wild card tiebreakers as well, making games against Atlantic rivals worth more than an equivalent game against a Western Conference opponent. That's a detail casual fans often miss: two wins are not always equal in value depending on who they come against and how the standings shake out elsewhere.
The Atlantic Division's depth means analysts project a mid-90s points range as roughly the threshold for wild card contention in a typical season. Falling short of that number by even a handful of points, which is exactly what happened to Detroit, illustrates how little cushion exists once the division gets this competitive. Every tiebreaker scenario ultimately traces back to games that felt inconsequential in November but mattered enormously by March.
Clinch's Perspective on Tracking Detroit's Odds
Live probability tracking matters most exactly when a season looks like Detroit's this year: close enough to feel alive, thin enough to collapse fast. Odds updated after every game, not once a week, are what let fans prioritize which nights actually carry stakes instead of guessing. Clinch's next update for Detroit's 2026-27 outlook lands with the season opener, refreshed after every game from there.
— Andrew
Where to Track Detroit's Playoff Odds Next Season
Clinch delivers live playoff odds and a daily rooting guide built from 30,000 simulations run after every game, so you always know which results actually move Detroit's number.

Once the 2026-27 season opens, Detroit's odds will update automatically on Clinch's Red Wings playoff odds page, with a free tier covering the team and paid access unlocking every other club across the league. Want to understand exactly how those percentages get calculated before you rely on them? Clinch's methodology breakdown walks through the model's tiers and assumptions in plain language. Check the odds after the opening night puck drop to see where Detroit stands.
Sources
- RECAP: 2026 Stanley Cup Playoffs out of reach for Red Wings after 5-3 loss to Devils — Detroit Red Wings
- Detroit Red Wings 2026-27 season preview — DailyFaceOff
FAQ
Can the Red Wings still make the playoffs?
No. Detroit was mathematically eliminated on April 11, 2026, after a 5-3 loss to the New Jersey Devils, closing off any remaining path for this season.
Have the Detroit Red Wings been eliminated from the playoffs?
Yes, elimination was confirmed on April 11, 2026, marking a 10th consecutive season without a playoff berth.
When were the Red Wings eliminated from playoff contention?
Detroit's elimination became official on April 11, 2026, following a loss to the Devils that closed the last mathematical path to a wild card spot.
Have the Red Wings made the playoffs recently?
No. This marks the 10th straight season Detroit has missed the postseason, one of the longer active droughts in the NHL.
How can I track Detroit's playoff odds for next season?
Clinch's Detroit Red Wings playoff odds page updates automatically after every game using 30,000 Monte Carlo simulations, giving fans a live probability feed once the 2026-27 season begins.