

The Oklahoma City Thunder and San Antonio Spurs currently anchor both sportsbook futures boards and Monte Carlo simulations as the top title contenders, with the Boston Celtics hovering close behind. The bigger story is where they disagree: simulations tend to spread probability more evenly across a deeper pool of contenders, while market odds compress around a handful of public favorites. If you're betting, that gap is where the value hides.
TL;DR:
- Market odds often favor popular teams like the Spurs and Thunder, who are priced around +270, but simulations reveal a wider range of realistic probabilities due to deeper analytics.
- Simulation models run thousands of iterations per update, providing clearer distinctions among contenders, especially for teams near the play-in cutoff or affected by injuries.
- Betting odds can move quickly based on public perception and injury news, while simulation percentages adjust more gradually, reflecting deeper statistical assessment.
- When market lines and simulation probabilities differ significantly, the slower-moving figure typically offers the most accurate reflection of a team's true playoff chances.
- Using both market and simulation insights together increases betting value, particularly when a large discrepancy exists between the projected probability and the current odds.
Table of Contents
- Current NBA Playoff Odds: Market Futures vs. Simulation Probabilities
- Why Sportsbook Odds and Simulation Models Tell Different Stories
- How to Read Playoff Probability Percentages
- Clinch's Simulation Approach to Live Playoff Odds
- Comparing Analytical Methods for Predicting Playoff Odds
- An Editorial Take on Reading Playoff Odds the Right Way
- Track Your Team's Real-Time Playoff Chances With Clinch
- Sources
- FAQ
Current NBA Playoff Odds: Market Futures vs. Simulation Probabilities
Sportsbook futures and simulation models are answering two different questions, and the numbers on the page reflect it. ESPN's live futures board currently shows the Spurs and Thunder both sitting at +270 to win the title, a near dead heat that reflects betting demand as much as raw team strength. Market prices move with public perception, injury news cycles, and the size of bets being placed, not purely with underlying win probability.
Simulation-based providers frame the race differently. Basketball-Reference's Playoff Probabilities Report runs 10,000 simulations per update and outputs both make-playoffs percentages and round-by-round advancement odds, including the play-in tournament. DunksAndThrees pushes that further with 60,000 simulations, producing tighter, less noisy percentiles, particularly useful for teams clustered near the play-in cutoff line where a single simulated result can swing a team's projected seed.
A snapshot of how these sources typically frame the same teams:
| Team Tier | Market Signal (Futures) | Simulation Signal (Model) |
|---|---|---|
| Top title contenders | Tightly priced, often within a few hundred points of each other | Wider spread; deeper roster metrics separate contenders more clearly |
| Play-in bubble teams | Longer odds, priced mostly on recent record | Make-playoffs percentage can shift several points on one game |
| Injury-affected teams | Odds move fast on breaking news | Move slower, pending explicit availability updates |
Three patterns show up consistently when you compare boards side by side:
- Market prices react to a star's injury within hours; simulation percentages often wait for the next full update cycle.
- Bubble teams near the play-in line show far more day-to-day volatility in model output than in sportsbook lines, because sportsbooks round off small edges that simulations track precisely.
- BetMGM's make-playoffs projections sometimes rate a fringe team's playoff chances higher than simulation models do, usually because the market is pricing in a favorable remaining schedule that hasn't fully filtered into a model's weekly run.
None of this means one source is "correct" and the other isn't. It means they're built for different jobs.
Why Sportsbook Odds and Simulation Models Tell Different Stories
Sportsbook lines are built from implied probability, then adjusted with a built-in margin called the vig, or juice, so the book profits regardless of outcome. A team priced at +270 doesn't imply exactly a 27% title chance. It implies something close to that once you strip out the vig, and it shifts constantly with betting volume rather than pure analytics.
Simulation models work differently. They run a season forward thousands of times using scoring margins, strength of schedule, and rest patterns as inputs, then count how often each outcome occurs. AP's coverage of the current playoff race makes this distinction explicit: market sentiment and model-based projections aren't the same signal, and mixing them up leads to bad bets.
Two situations show the split clearly:
- Public money inflates favorites. A marquee franchise with a national fanbase often gets bet down to shorter odds than its underlying numbers justify, simply because more money is flowing to that side.
- Models hedge on depth and injury risk. A team with a thin bench or an aging core might get a lower simulation-based round probability than its win total suggests, because the model accounts for missed games that haven't happened yet.
Pro Tip: When a market line and a simulation percentage disagree by a wide margin, check which one moved more recently. The slower-moving number is usually the one still waiting on new information.
How to Read Playoff Probability Percentages
A team's "make playoffs" number, its "win round" number, and its "win title" number measure completely different things, and confusing them is the most common mistake fans make with these tools. Make-playoffs percentage only covers clearing the play-in and postseason cutoff. Round-advancement percentage measures survival through a specific series. Title percentage compounds every round together, which is why even a strong contender often shows a title number well under 25%.
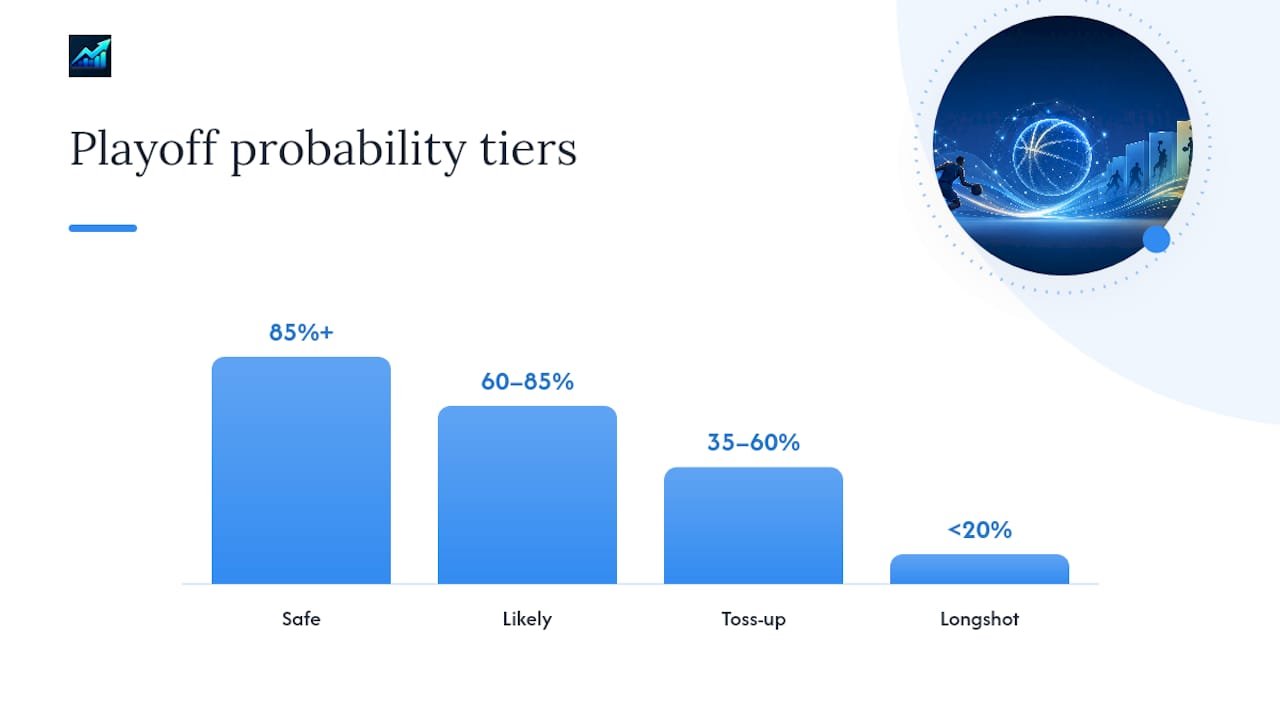
A rough tier system helps translate percentages into expectations:
- Safe (85%+ make playoffs): Variance mostly affects seeding, not postseason inclusion.
- Likely (60% to 85%): A losing stretch of 5 to 7 games can meaningfully change the picture.
- Toss-up (35% to 60%): Nearly every remaining game matters; check updates after each result.
- Longshot (under 20%): Treat any bet here as a value play, not an expectation, and size it accordingly.
Convert the percentage into a decision rather than staring at it. A 40% round-win probability roughly implies plus-money value if a sportsbook is offering worse than even odds on that outcome. Track the next 3 to 5 games for any team you're watching or holding a position on. Those results move probability numbers more than anything else this time of year.
Clinch's Simulation Approach to Live Playoff Odds
A sports analytics app runs tens of thousands of Monte Carlo simulations after every game to update NBA playoff probabilities for all 30 teams, using a sample size well above the typical simulation standard. That volume matters because larger simulation counts reduce sampling noise, which keeps day-to-day percentage swings tied to actual game results rather than random variance in the model itself.
The methodology behind Clinch's numbers accounts for player availability and applies play-in tournament rules directly into make-playoffs calculations, so a team's odds reflect its real path rather than a simplified seeding assumption. What that gets you in practice:
- Live percentage updates within minutes of a final score, not a once-a-week batch refresh.
- A rooting guide that flags which other games actually move your team's odds, so you're not scoreboard-watching blind.
- Plain-English explanations of why a number changed, not just the raw percentage shift.
Updates of 30,000 simulations per run provide a sample size roughly triple the standard used by many public playoff probability tables, leading to steadier, less noisy percentage movement between games.
Comparing Analytical Methods for Predicting Playoff Odds
Three broad approaches dominate playoff prediction, and each trades accuracy for speed differently. Power-rating systems rank teams on a single efficiency number and project outcomes from that gap. They're fast to compute and easy to explain, but they flatten roster nuance like injury depth or matchup-specific weaknesses.
Monte Carlo simulation, the method behind Basketball-Reference, DunksAndThrees, Predictium, and Clinch, runs the remaining schedule forward thousands of times and counts outcomes. Accuracy scales with sample size. A 10,000-simulation run captures the broad shape of a race; a 30,000 to 60,000-simulation run resolves close bubble scenarios with far less statistical noise, which is why sample size gets treated as a real quality signal rather than a marketing number.
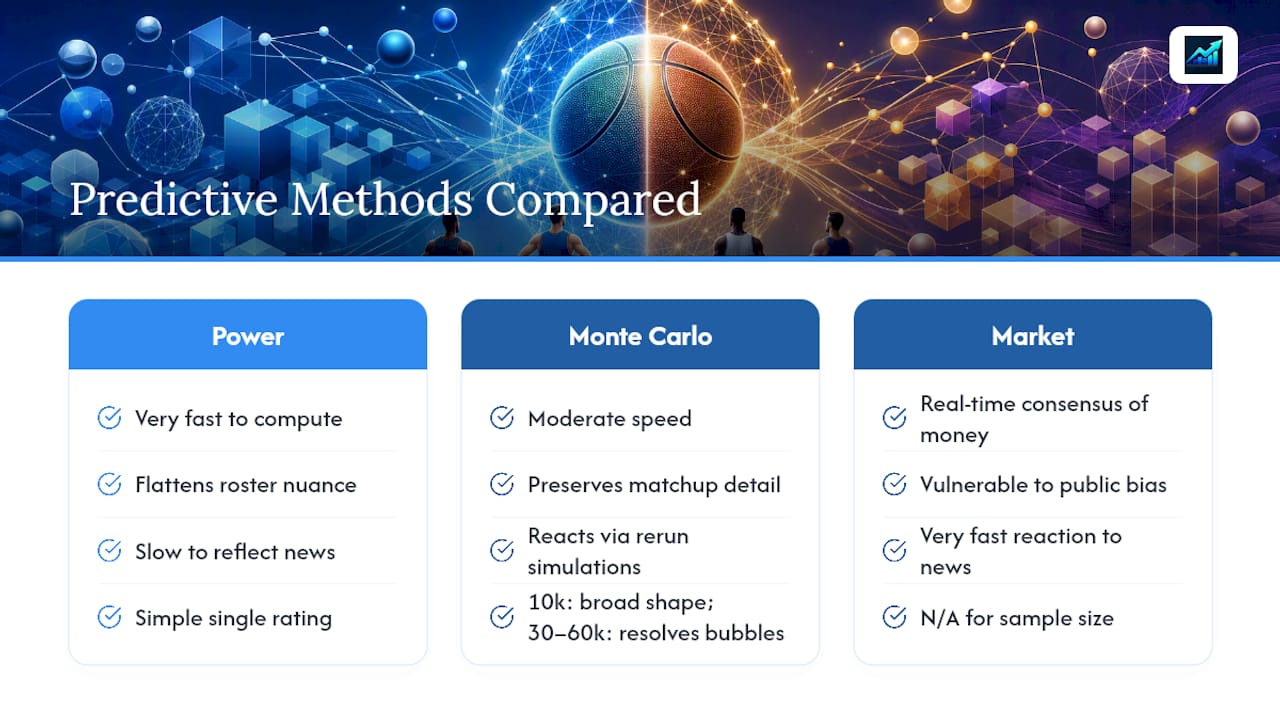
Market-based models, meanwhile, aren't predictive systems at all. They're a real-time consensus of money, which makes them fast to react to news but vulnerable to public bias on popular teams. Predictium's published methodology documents choices like availability overrides and travel-fatigue adjustments, both details that shape how quickly a simulation reacts to a lineup change versus how a betting line reacts to the same news. Bettors get the sharpest read by comparing at least one simulation source against the market rather than trusting either alone.
An Editorial Take on Reading Playoff Odds the Right Way
The most common mistake is treating a market line as a prediction instead of a crowd's bet. The fix is simple: use simulations to find the number, use the market to find the price, and bet only where a real gap exists between them. Root emotionally if you want, but decide with the model.
— Andrew
Track Your Team's Real-Time Playoff Chances With Clinch
Clinchsports gives you the simulation side of this comparison without the wait for a weekly update. Every NBA team gets 30,000 fresh Monte Carlo simulations after each game, translated into plain-English percentage changes and a rooting guide that tells you exactly which other results tonight will move your team's number. That combination, high sample size plus context on why a number shifted, is built for fans and bettors who want more resolution than a once-a-day futures board.

It fits three kinds of readers best: fans who want to know their team's real path without doing the math themselves, bettors hunting for gaps between market price and model probability, and anyone tired of stale playoff picture graphics. A free tier covers one team per league, and a subscription unlocks full access to all teams and features. Check your team's live NBA playoff odds right now and see what actually moved the number since last night's games.
Sources
- NBA Futures - 2026-27 NBA Finals Champion Odds
- Basketball-reference
- NBA Playoff Odds 2026: Postseason Projection for Each Team | BetMGM
FAQ
Who is favored to win the NBA playoffs?
The Oklahoma City Thunder and San Antonio Spurs currently share the top spot on ESPN's futures board, both priced around +270, with the Boston Celtics close behind in both market odds and simulation output.
What's the most loved NBA team?
Fan popularity doesn't map directly to playoff probability data, but title-contending, high-visibility franchises like the Celtics and Lakers consistently draw the largest betting volume and media attention during playoff races, which is part of why their market odds often run shorter than simulation models would price them.
Who swept LeBron James in the playoffs?
LeBron James has been swept in a playoff series more than once across his career, most notably by the San Antonio Spurs in an NBA Finals series with the Cleveland Cavaliers.
Who are the favorites to win the 2026 NBA Championship?
As of the current season, the Thunder and Spurs lead both sportsbook futures and simulation-based title probabilities, with the Celtics positioned as the next tier down in most models.
How often do NBA playoff odds update?
Sportsbook futures like ESPN's board update continuously with betting activity, while simulation models such as Clinch's recalculate after every game using a fresh 30,000-simulation run, keeping the percentages tied to actual results rather than a fixed weekly schedule.